Analyze a CSV in Looker Studio: From Connector to Data Source
Google's free Looker Studio (formerly Data Studio) can turn a CSV file straight into an interactive dashboard. This walks you through the crucial first step: pick the 'Upload CSV' connector, authorize Google Cloud Storage, create a dataset, upload the file, and confirm the field schema — laying the groundwork before you build any charts.
 卡住很正常——點段落旁的 😵 卡關 讓我們知道,或直接往下滾到問答區發問。
也可以用 👍 看懂 / 😢 看不懂 告訴我們哪裡寫得好、哪裡要改。
卡住很正常——點段落旁的 😵 卡關 讓我們知道,或直接往下滾到問答區發問。
也可以用 👍 看懂 / 😢 看不懂 告訴我們哪裡寫得好、哪裡要改。
In one line: In Looker Studio, click Create → Data source, pick the “Upload CSV” connector, authorize Google Cloud Storage once, create a dataset, drop your CSV in, confirm the schema, and click Connect — your CSV becomes a chart-ready data source.
Keywords: Looker Studio, Data Studio, upload CSV, connector, data source, dataset, Google Cloud Storage, field schema
What is Looker Studio, and why use it for CSVs?
Looker Studio is Google’s free data-visualization tool (it has a bit of a naming identity crisis: it used to be Data Studio, and the interface now also labels it “數據分析” in Chinese — same product). You connect data, build interactive charts and dashboards by dragging fields around, and share them.
It connects to many sources (Google Sheets, BigQuery, Google Analytics…), but the simplest and most beginner-friendly is to upload a CSV file directly. Got an Excel/CSV and want to spot trends fast? This is the shortest path.
This example uploads a café sales CSV (dirty_cafe_sales.csv) and covers the “turn a CSV into a data source” leg. Building charts is the next article, but the foundation is right here.
Step 1: Open the Looker Studio home
Open lookerstudio.google.com and sign in with your Google account. On the home page, the left nav shows Create, Recent, Shared with me, Owned by me, Templates…; the middle has three “get started” cards: Create a report / Analyze with conversation / Learn Looker Studio, with your recent reports and data sources listed below.
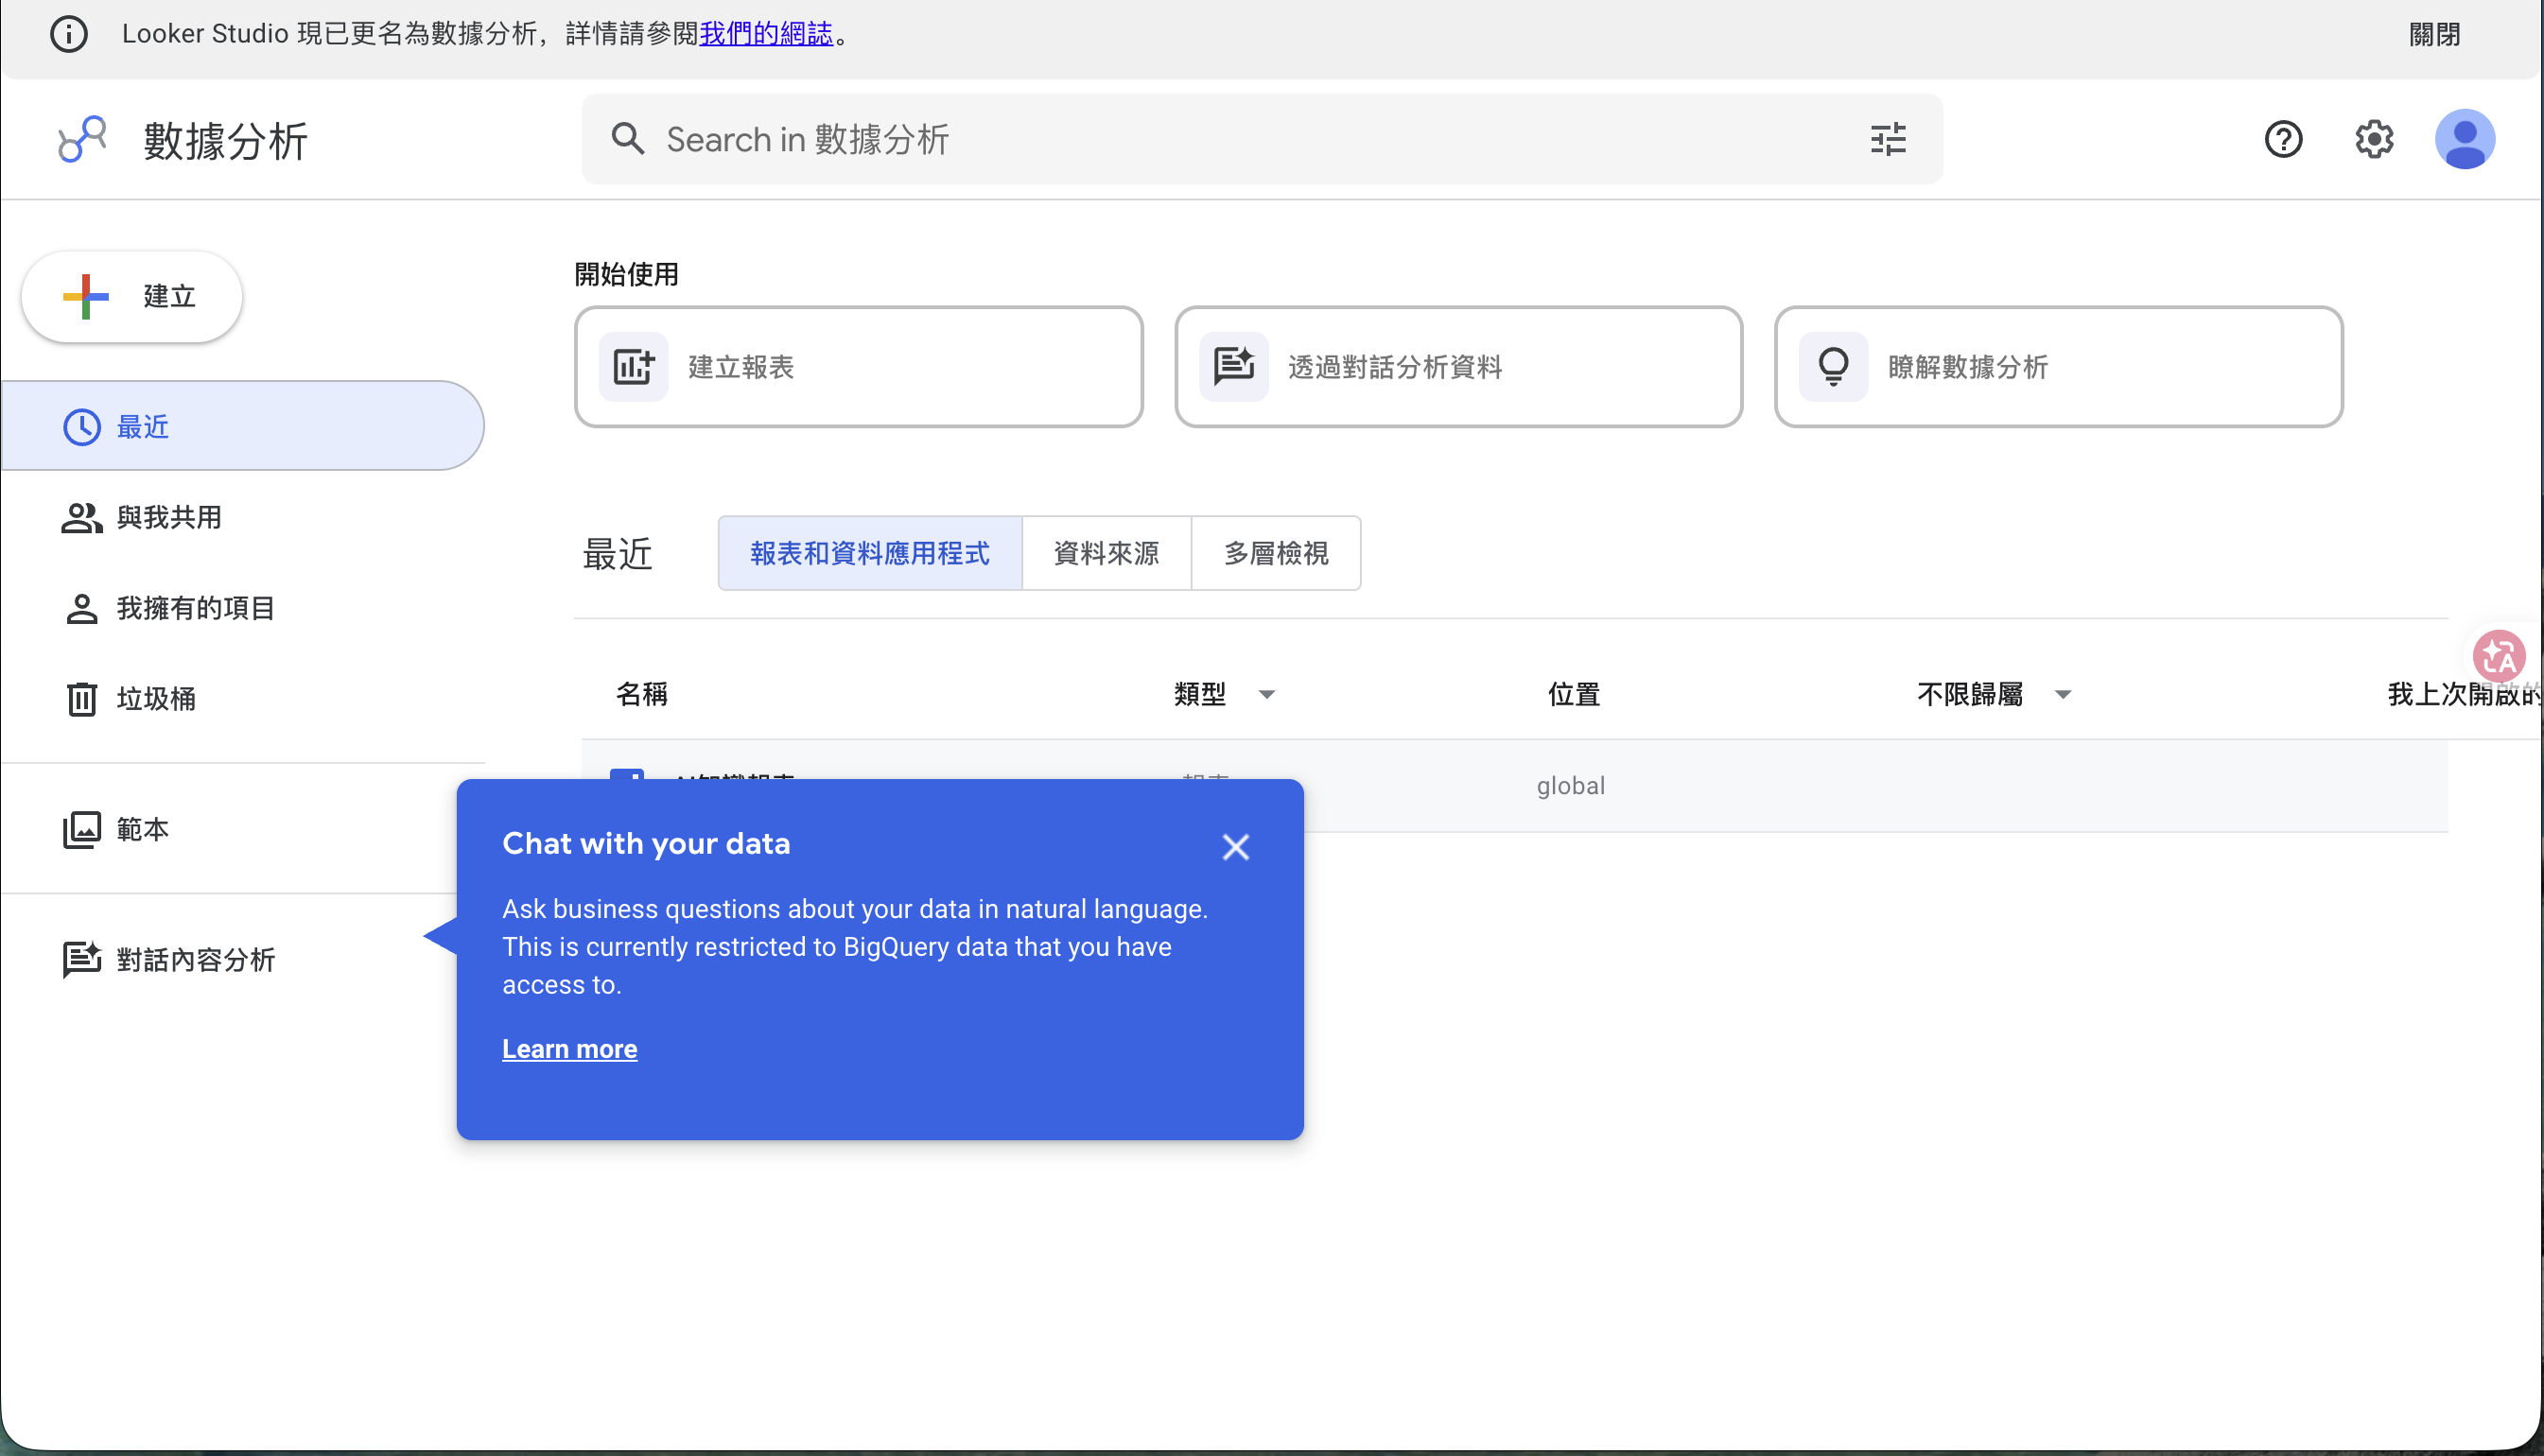
Step 2: Create a new data source
Click the Create button top-left; the menu expands into Report / Conversation / Data source / Explorer. We want Data source.
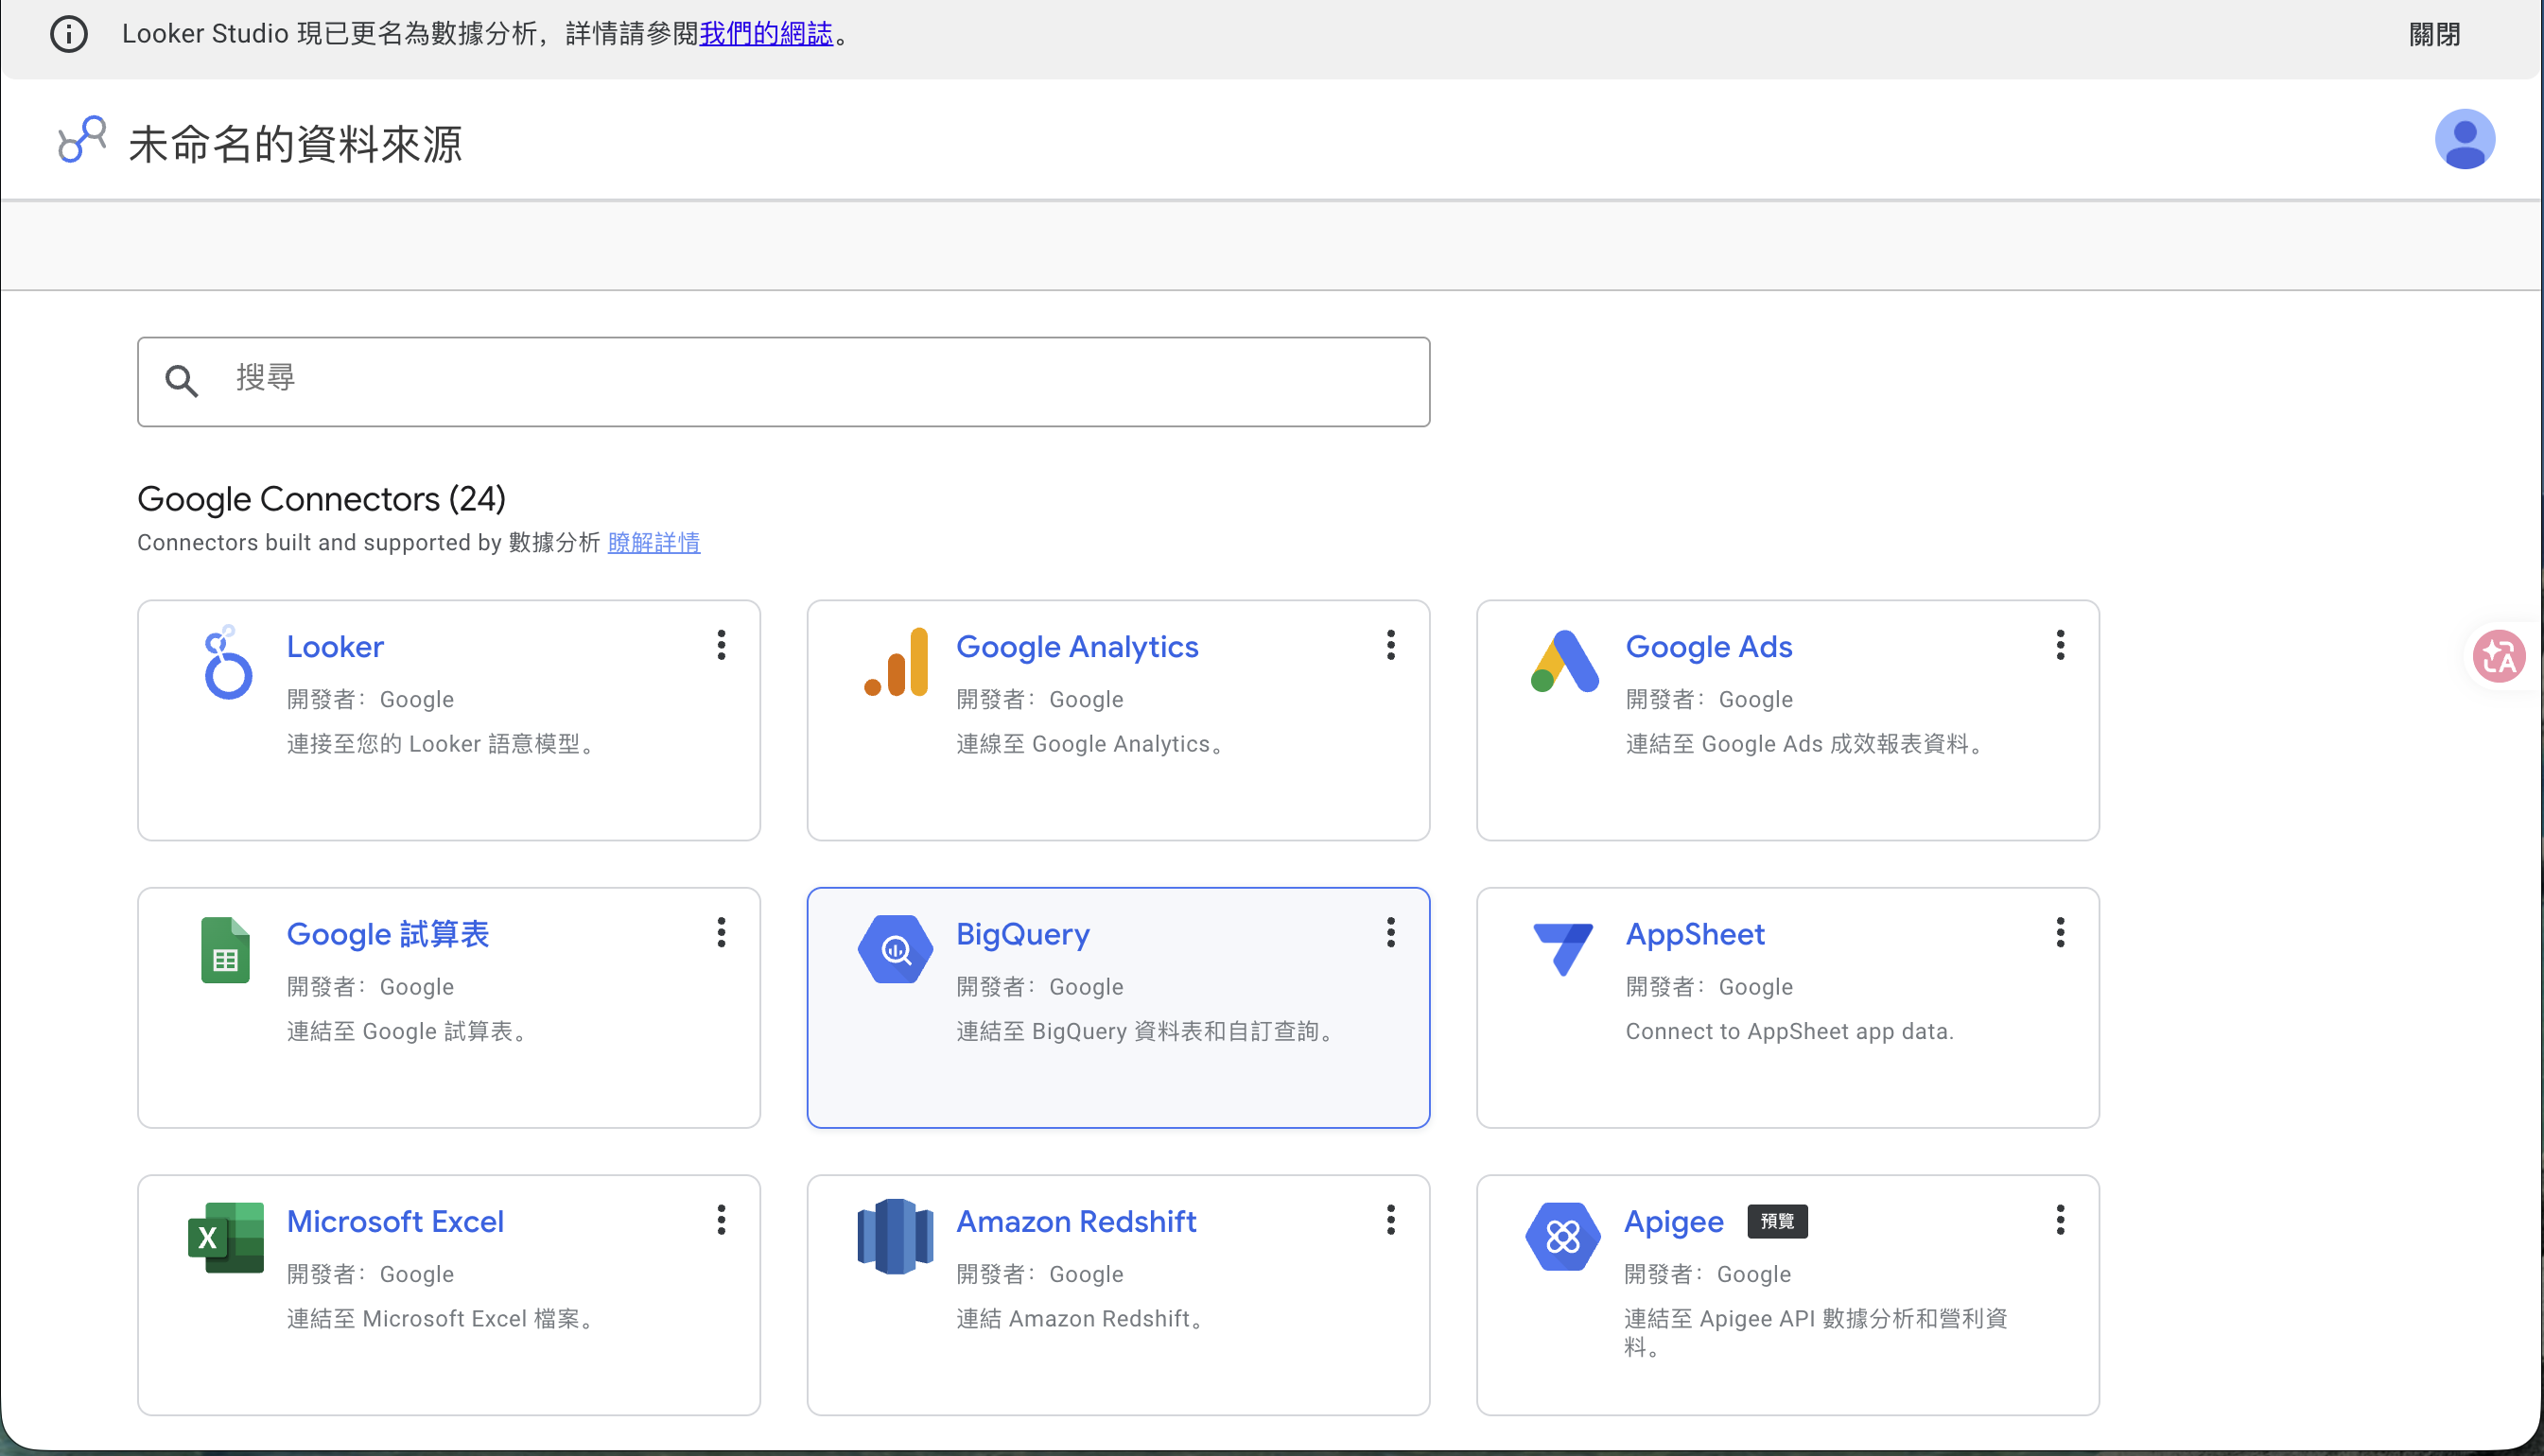
On the “Untitled Data Source” page you’ll see a row of Google Connectors: Looker, Google Analytics, Google Ads, Google Sheets, BigQuery, AppSheet, Microsoft Excel… each is one way to bring data in.
Step 3: Pick the “Upload CSV” connector
Find “Upload CSV file” in the connector list (developer: Google, described as “Connect to a CSV (comma-separated values) file”). Click it.
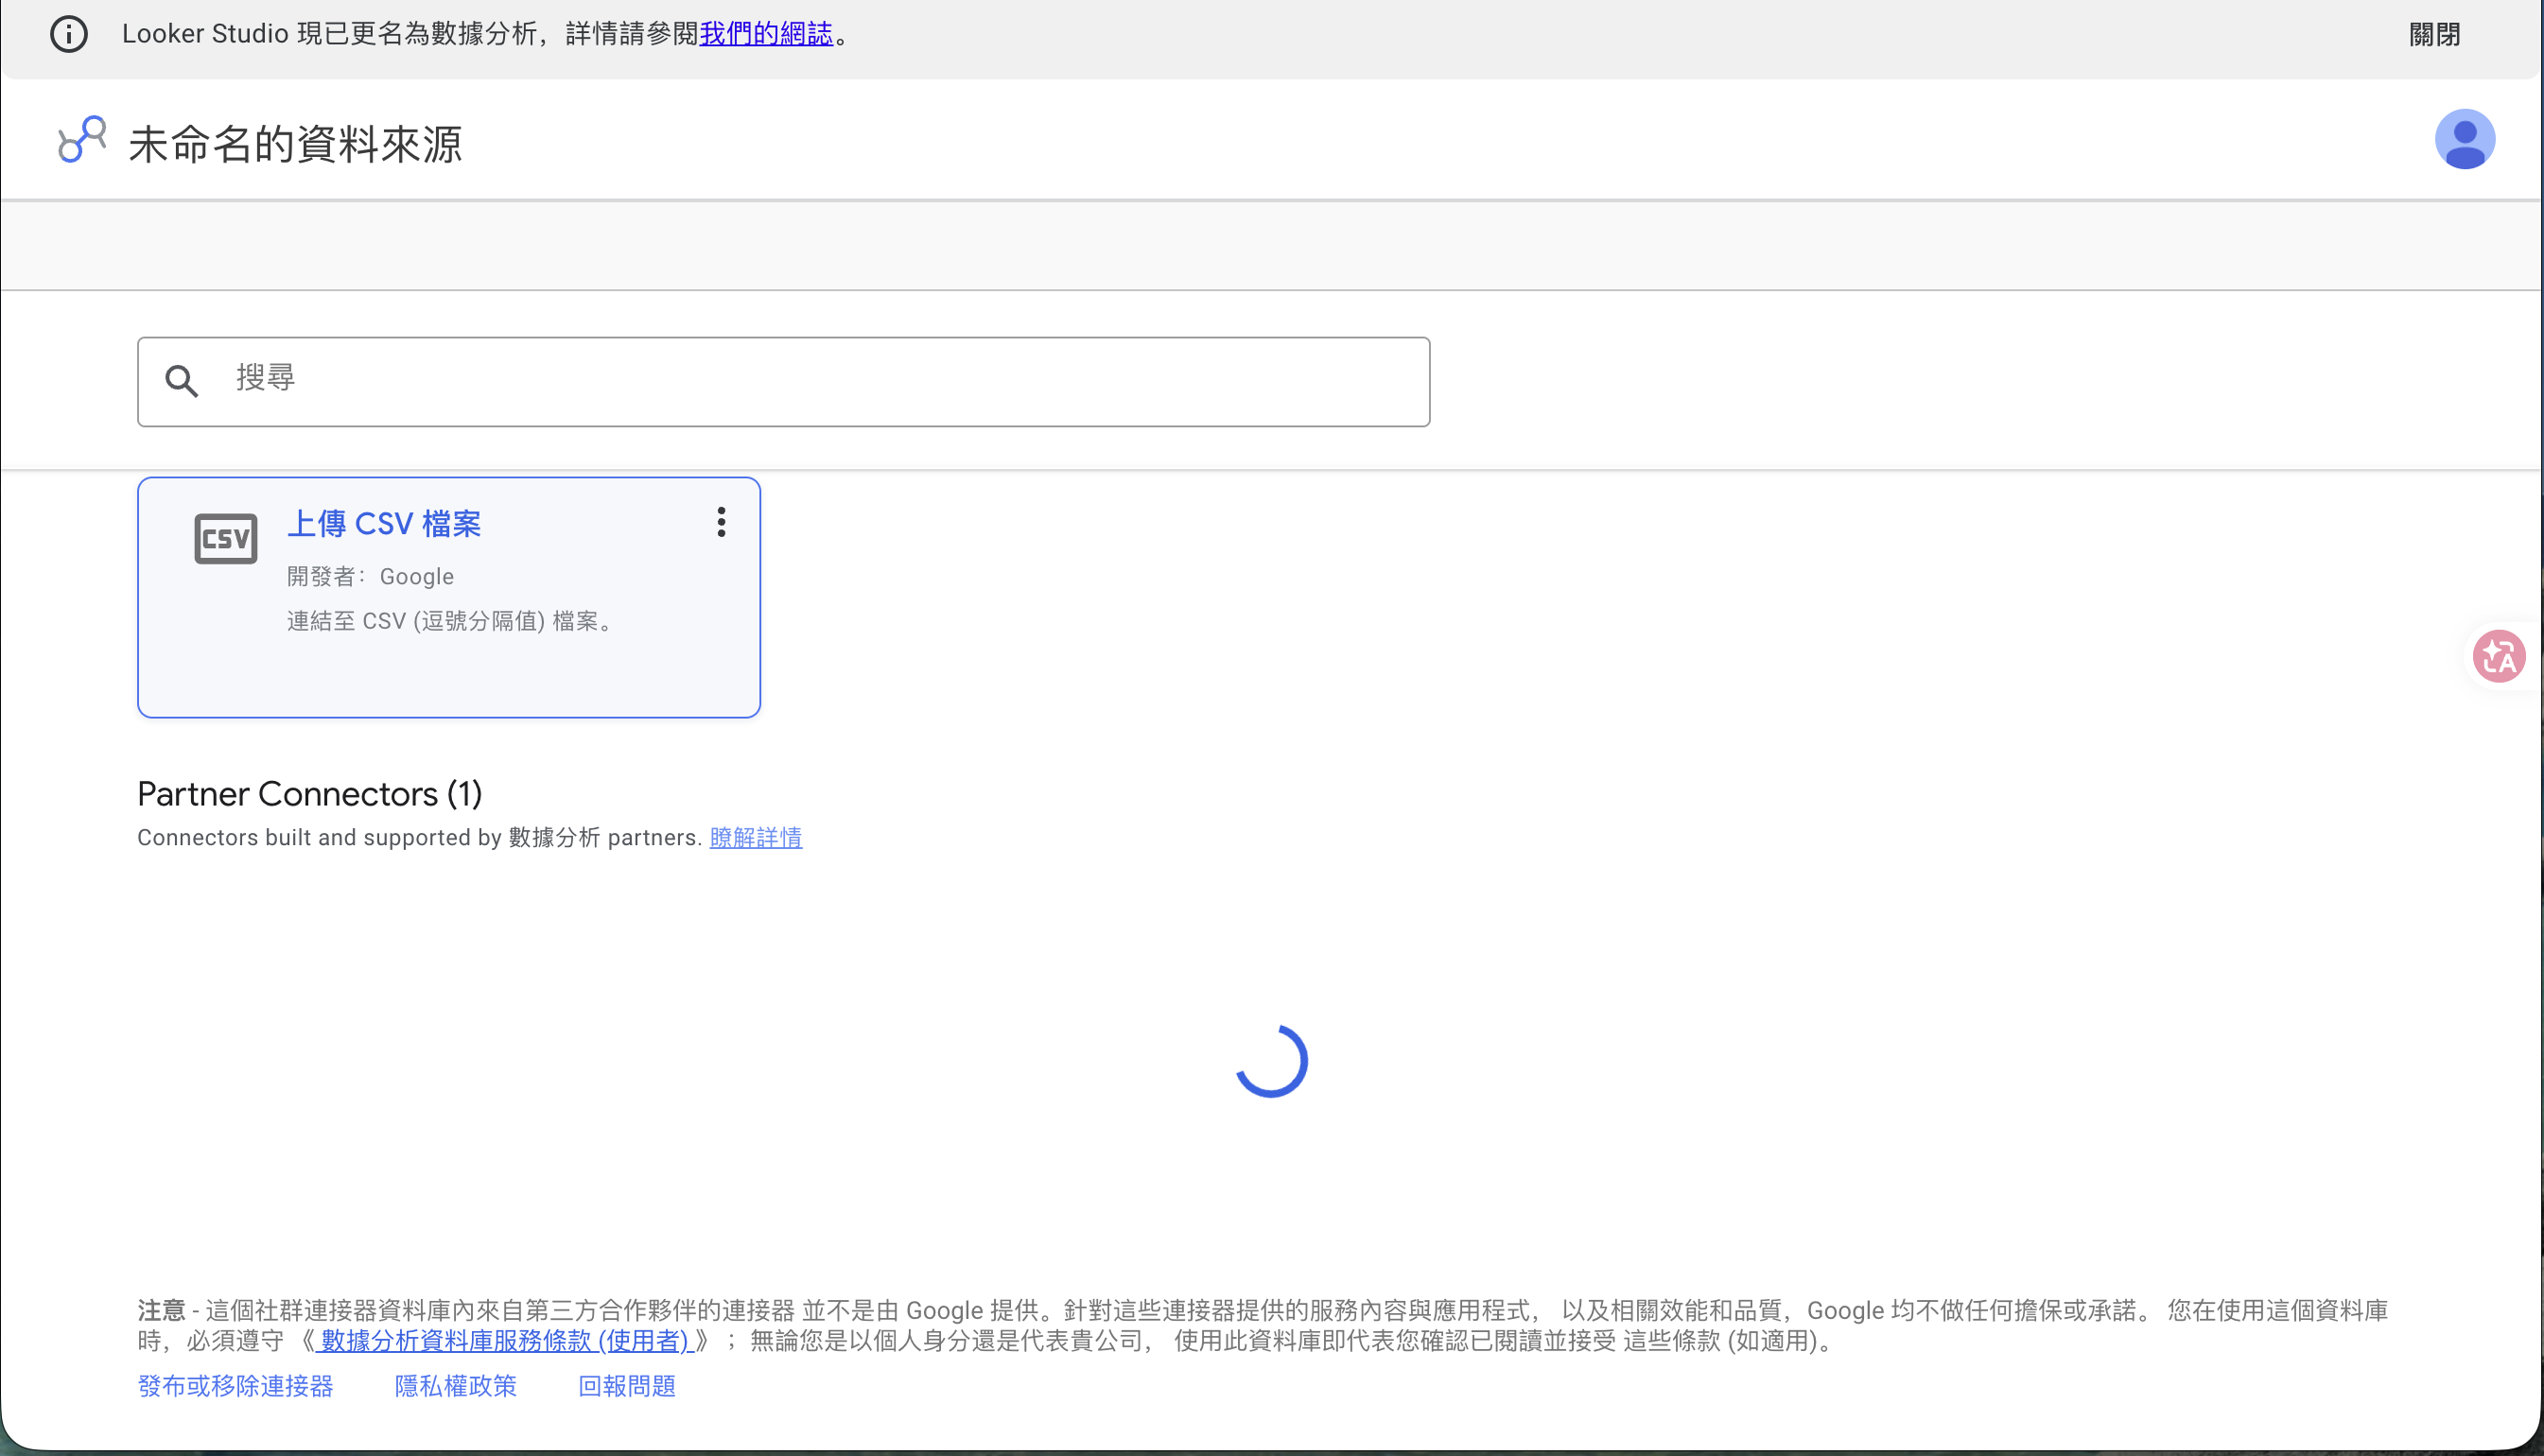
🚨 Too many connectors — can’t find Upload CSV?
The list shows Google’s popular connectors first (BigQuery, Analytics…). The CSV tile sits further down; the fastest way is to type “CSV” in the search box at the top, or scroll down a bit.
Step 4: Authorize Google Cloud Storage (just once)
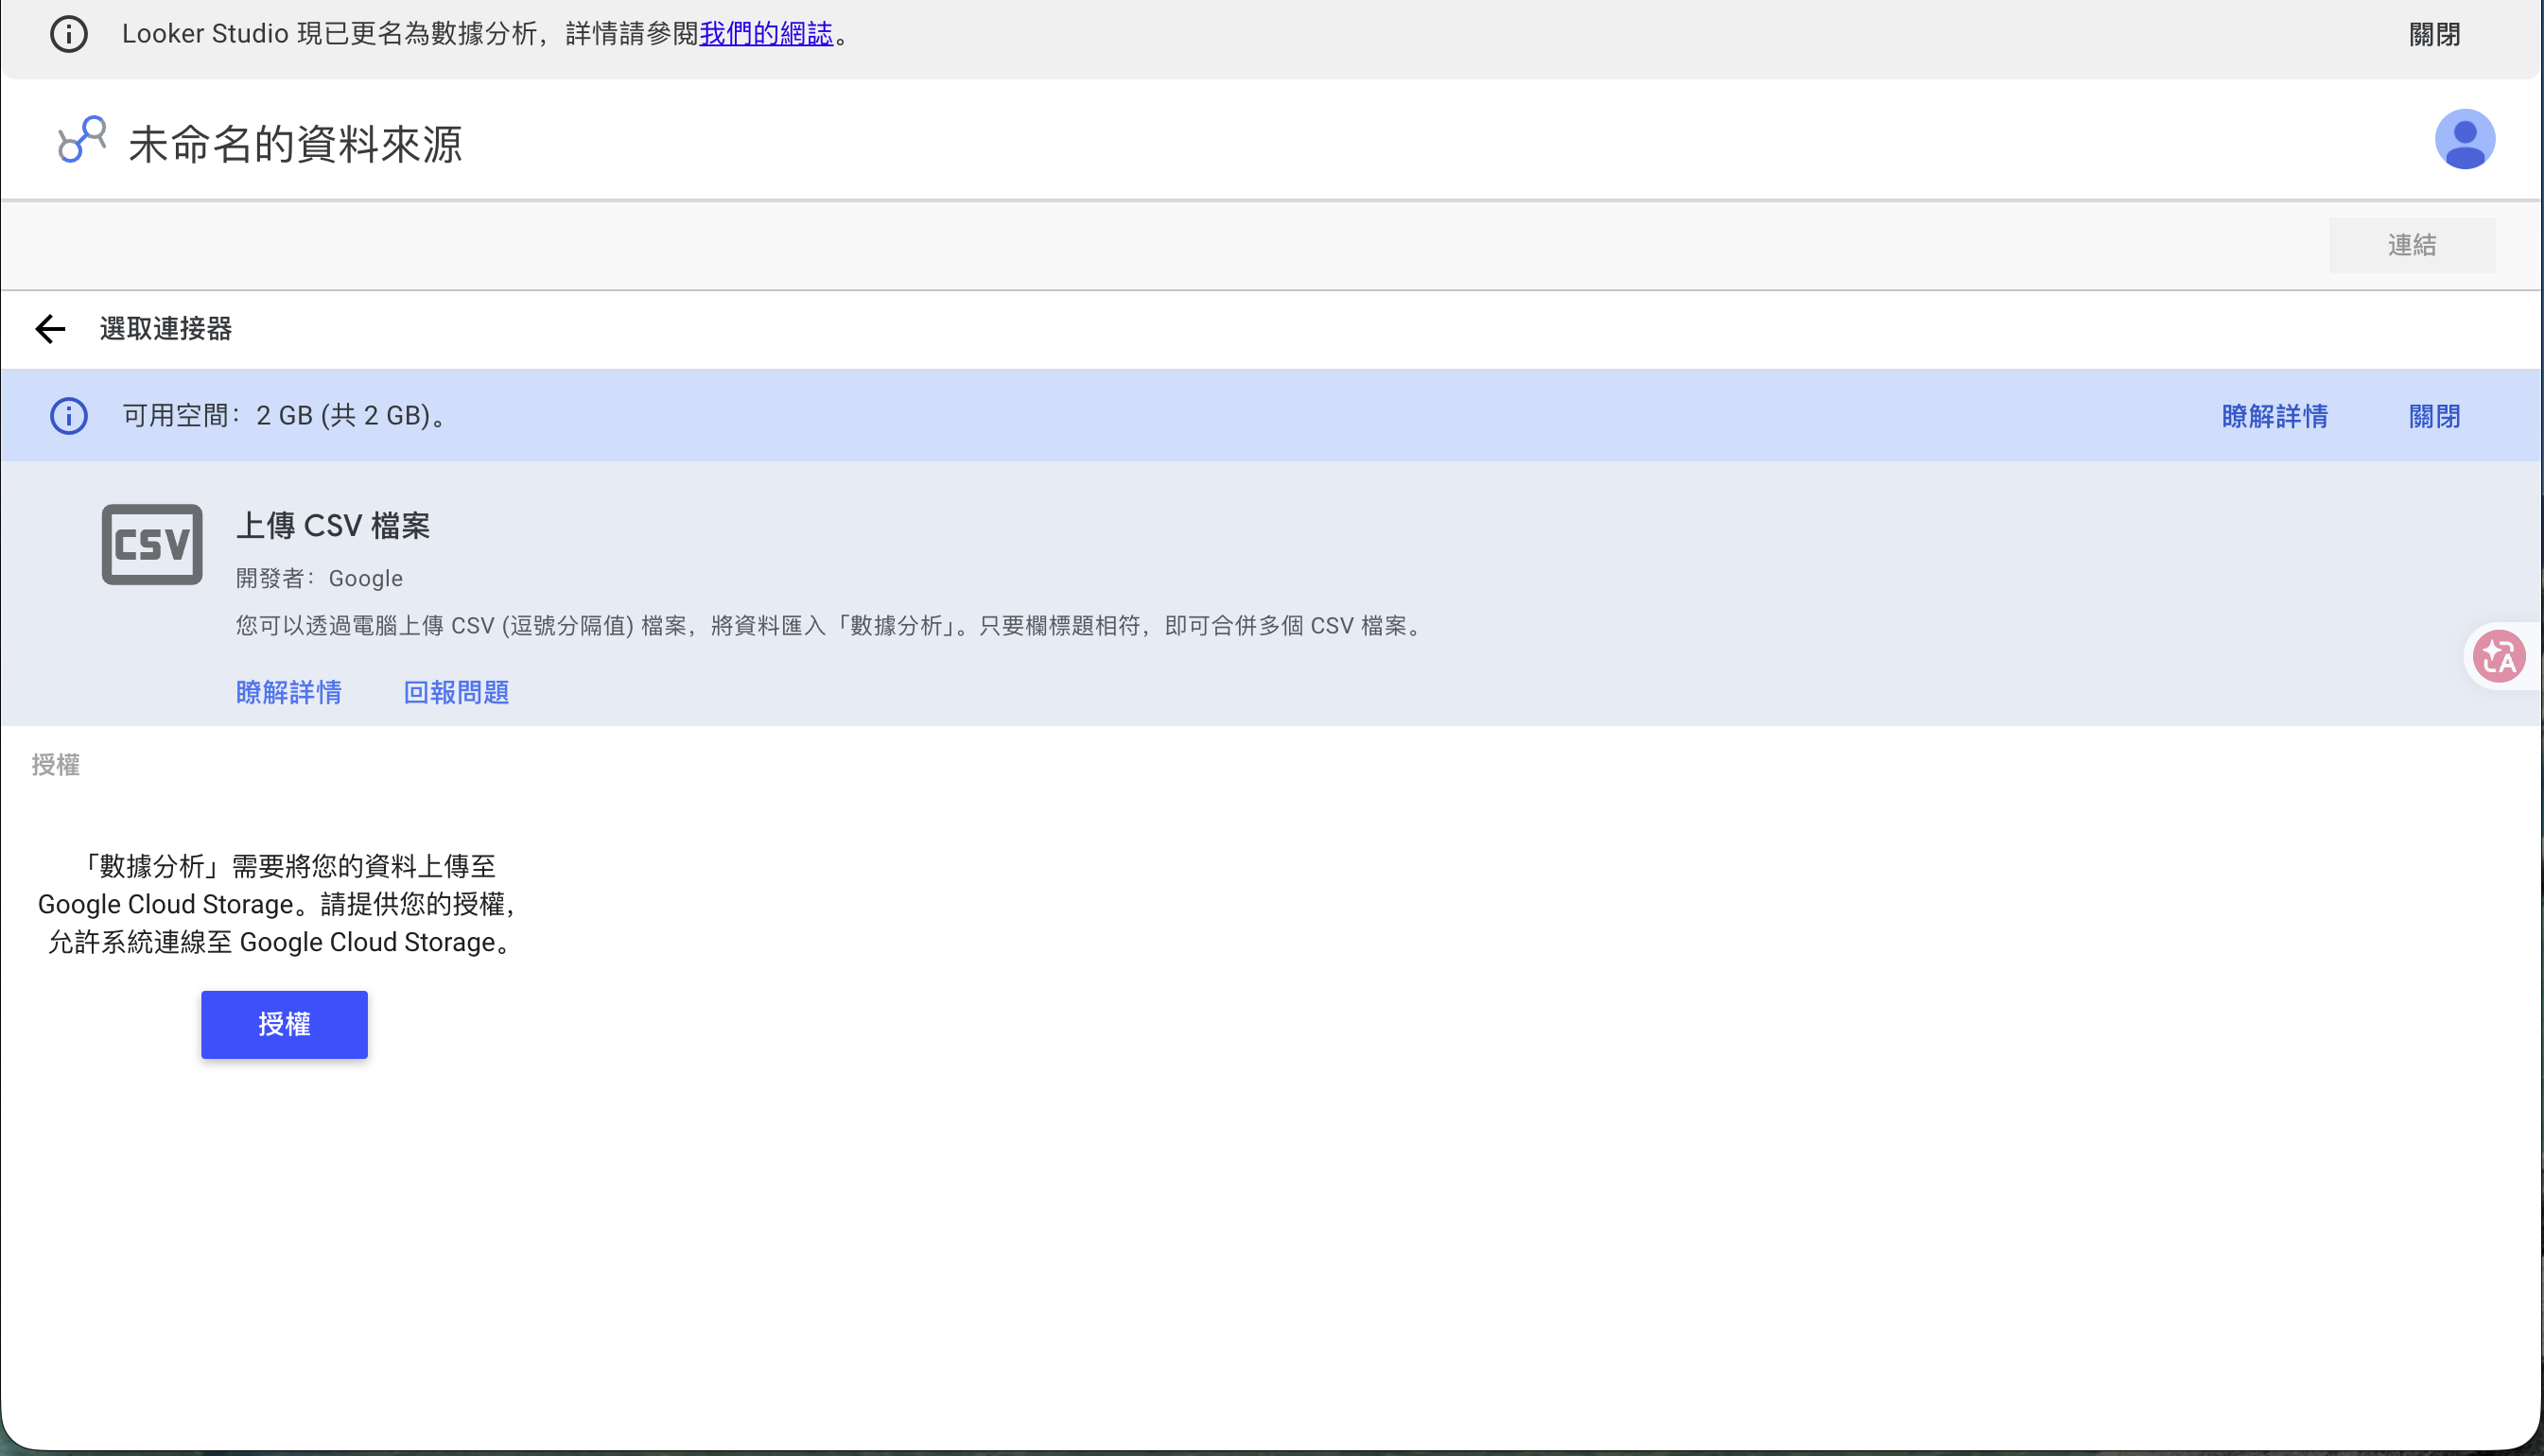
The first time you use the CSV connector, Looker Studio tells you: “Looker Studio needs to upload your data to Google Cloud Storage. Please authorize.” and asks you to click Authorize.
That’s because your CSV is actually stored in Google’s cloud storage (every account gets 2 GB free). After you authorize, a Google account chooser pops up — pick your account and consent. You only do this authorization once; future CSV uploads won’t ask again.
Step 5: Create a dataset and upload the CSV
After authorizing, you get a three-column workspace: Datasets / Files / Schema.
-
In the left Datasets column, click ”+ Create dataset”, name this batch (the example uses
cafe), and click Continue.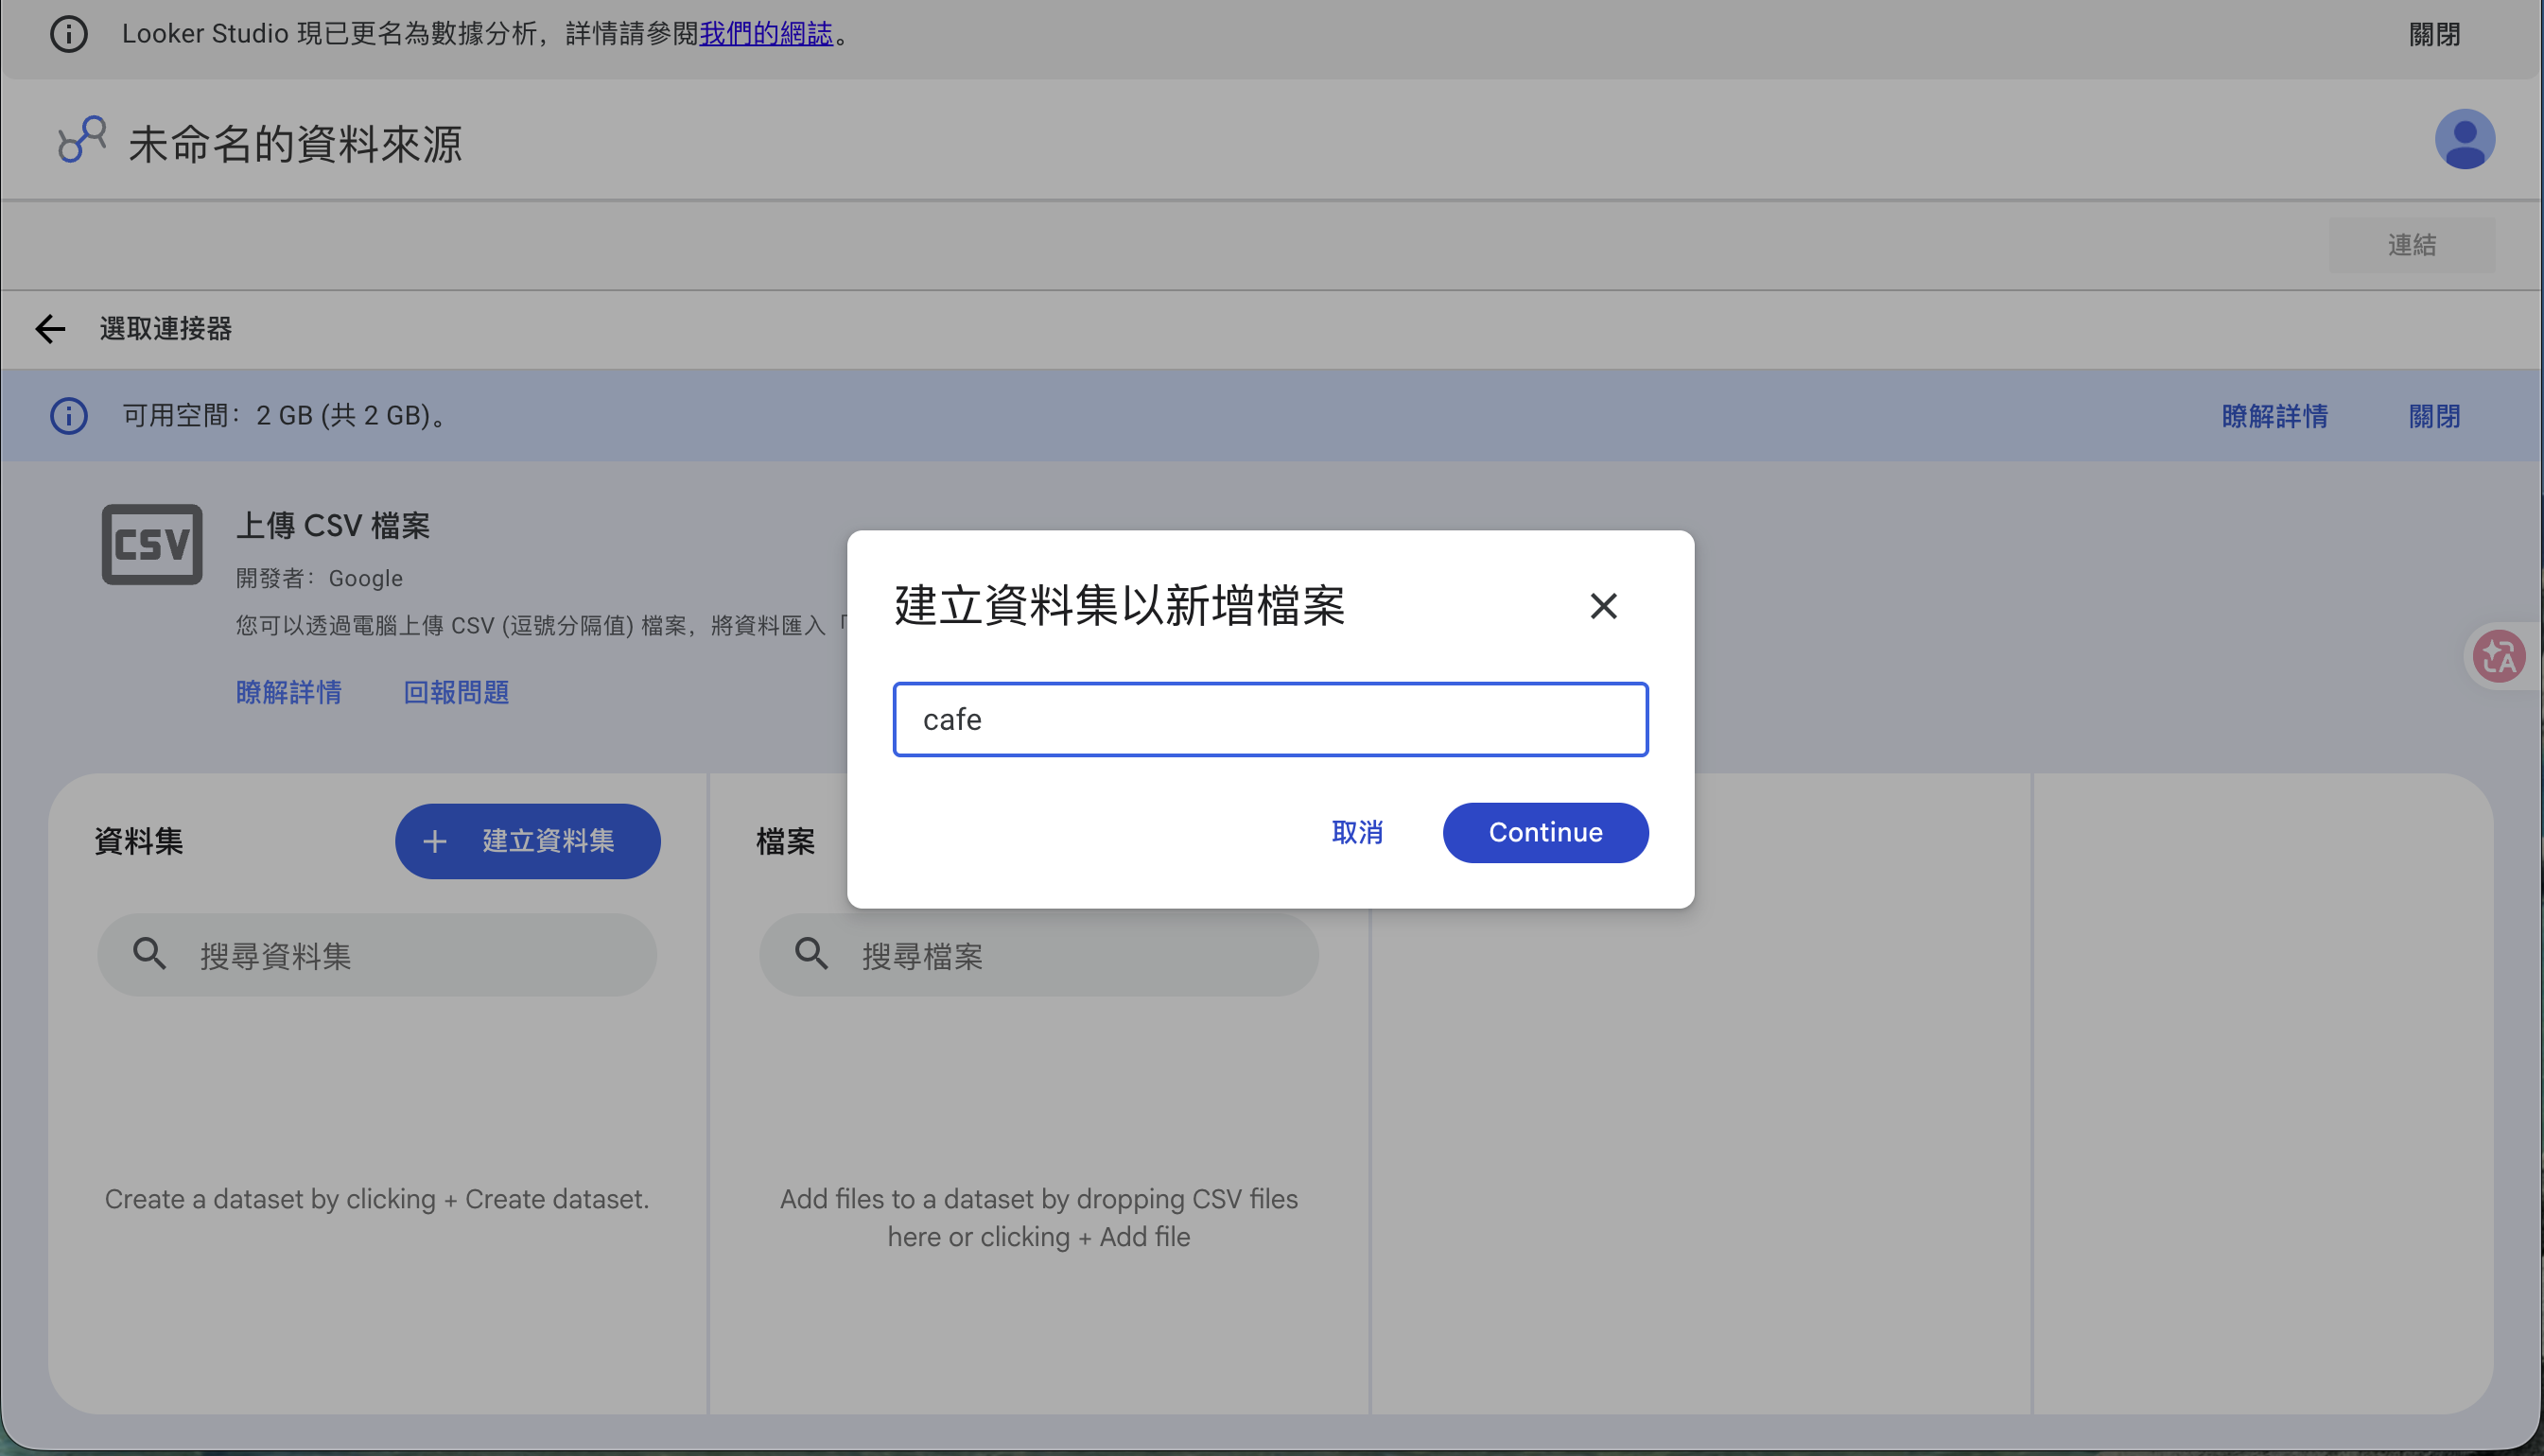
-
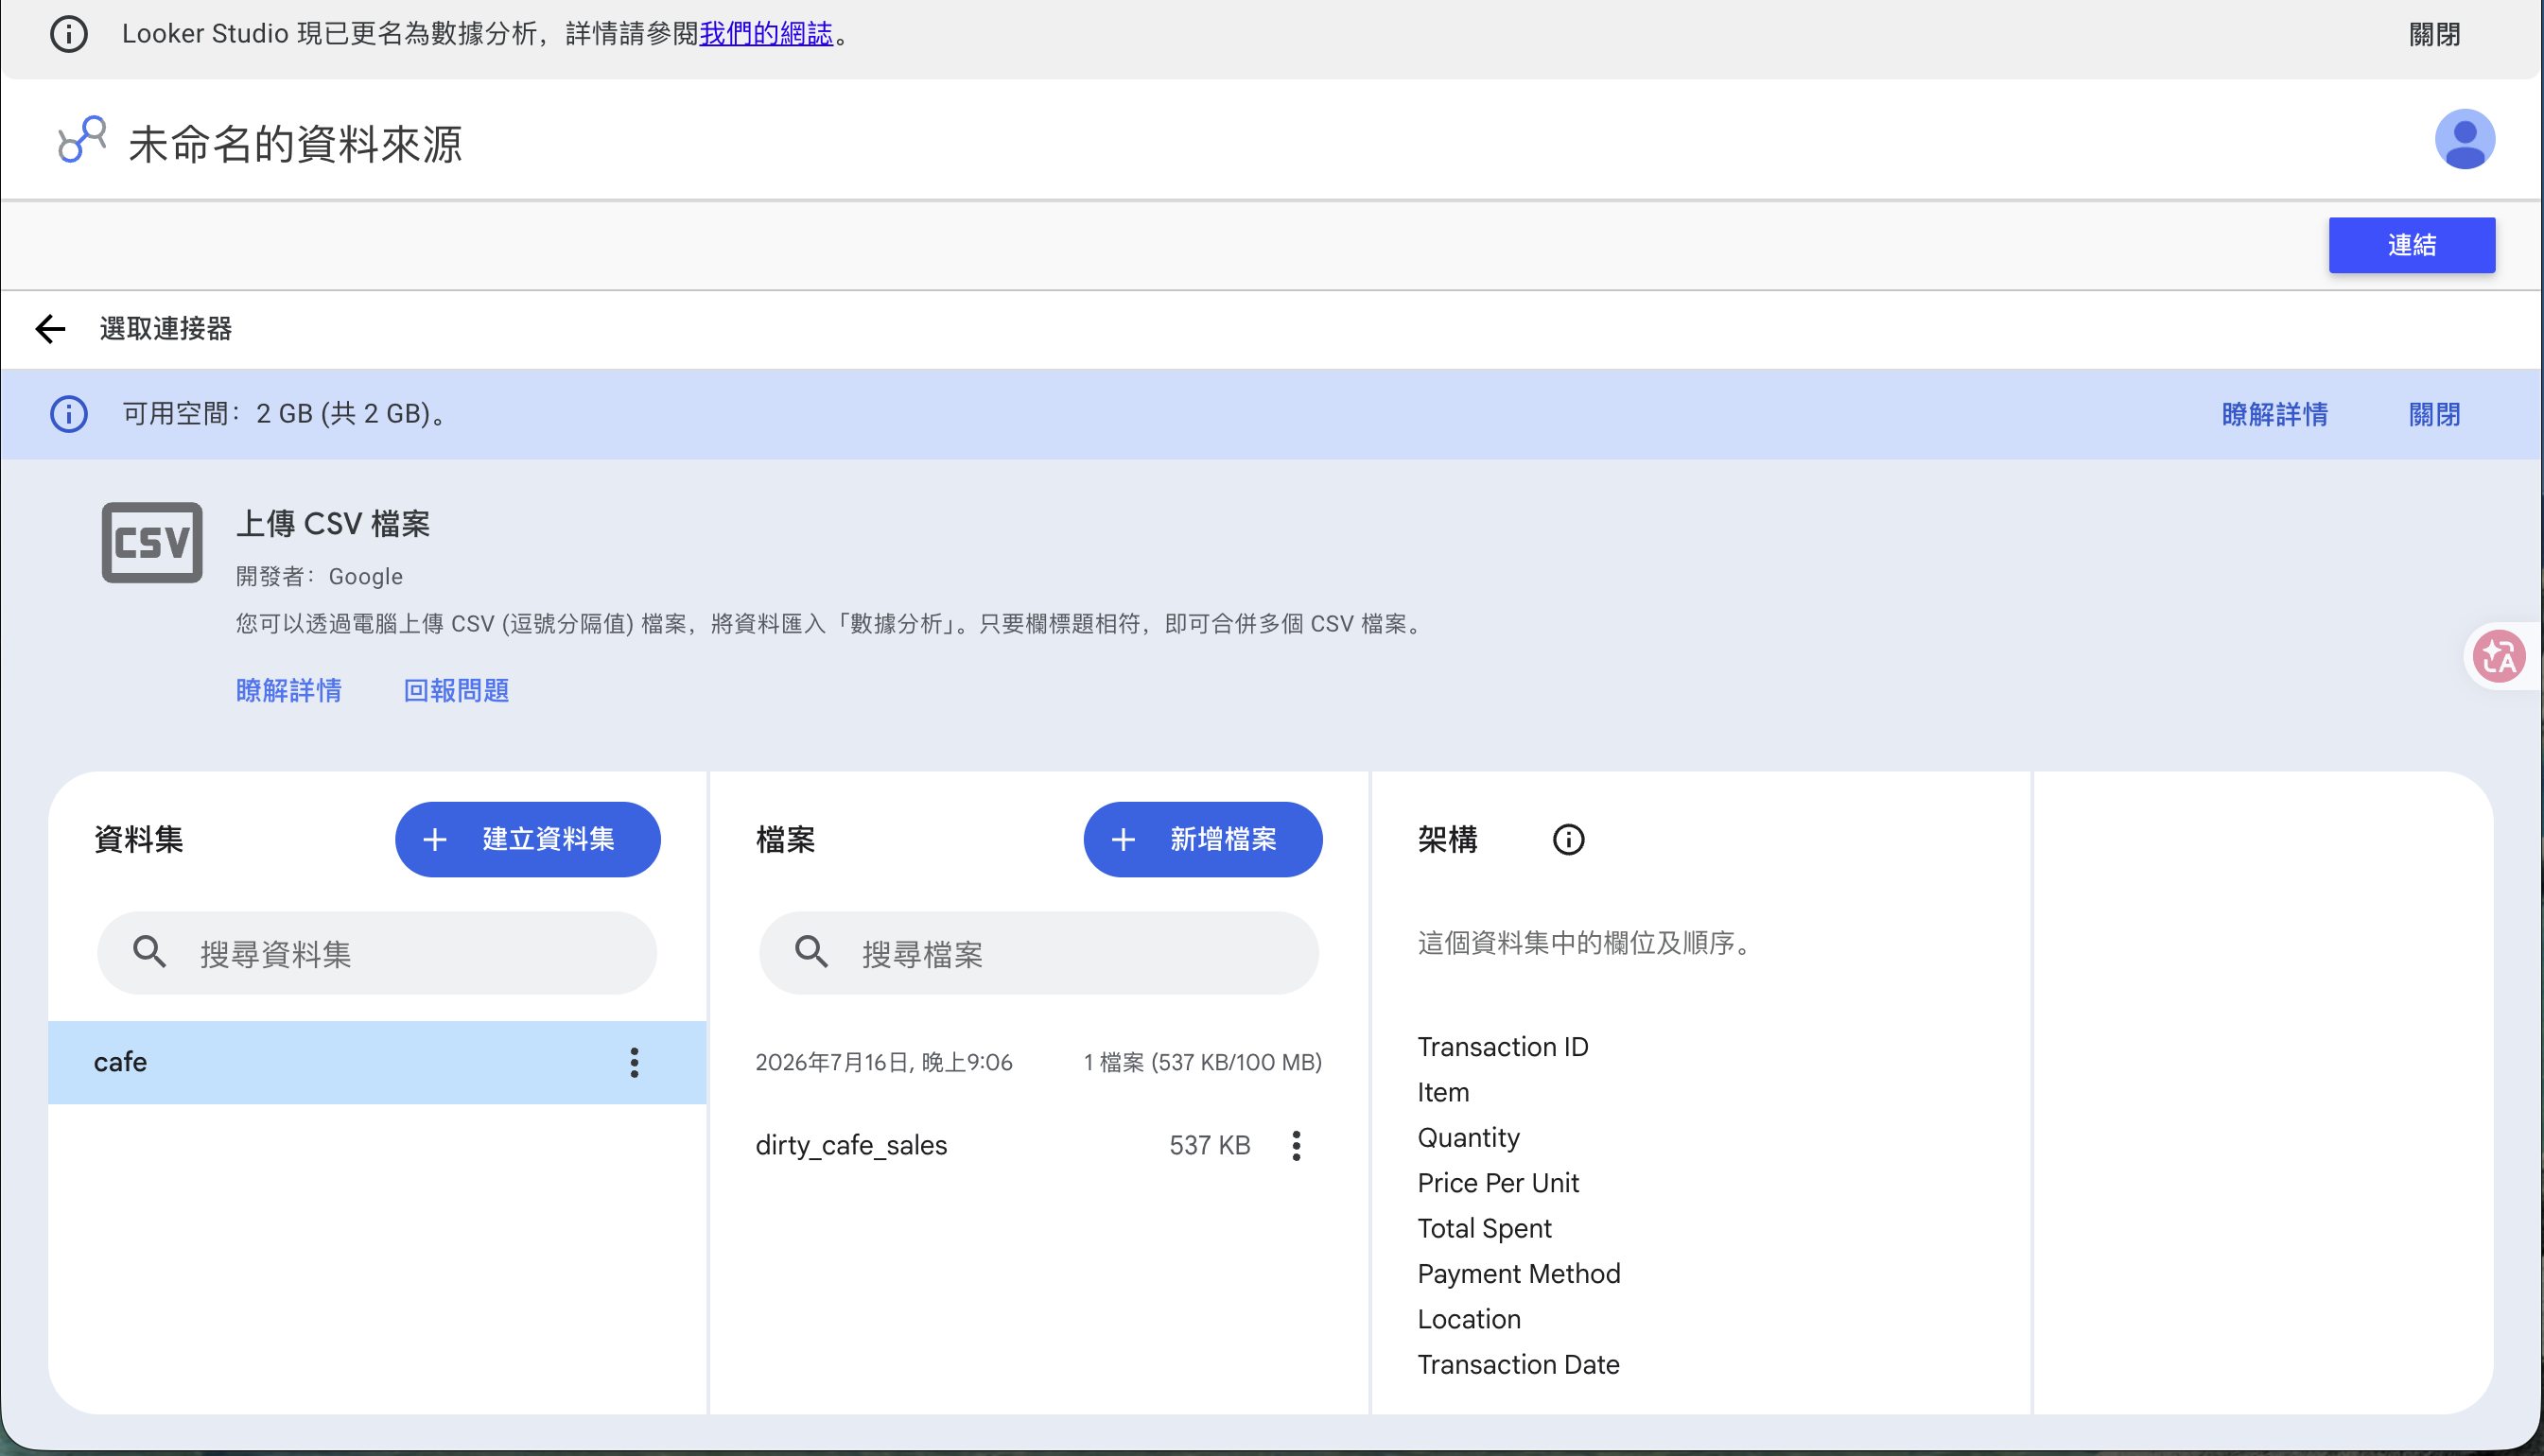
Then in the middle Files column, click ”+ Add file” or drag the CSV in. Max 100 MB per dataset.
Step 6: Confirm the schema and click Connect
After the file uploads, the right Schema column lists the fields Looker Studio auto-detected. For the example café sales data, it found: Transaction ID, Item, Quantity, Price Per Unit, Total Spent, Payment Method, Location, Transaction Date.
Once the fields look right, click Connect top-right, and the CSV officially becomes a data source you can build reports on.
🚨 Numbers treated as text, dates not recognized?
CSVs carry no type information, so Looker Studio guesses. If an amount column is read as “text” or a date isn’t recognized as a “date,” don’t rush into charts — in the data source’s field list, manually change that field’s type to Number or Date. The sample file being named dirty_cafe_sales is a hint: real-world data often needs cleaning and type-fixing before the charts will render.
Done! What’s next?
You’ve now turned a CSV into a Looker Studio data source. Next:
- Go to Create → Report and pick this data source.
- Drop in a table or bar chart and drag fields (e.g., Item, Total Spent) onto it.
- Looker Studio computes live — which item sells best, which location earns most, at a glance.
The data source is the foundation; the report is the building. With the foundation set, building goes fast.
這篇文章對你有幫助嗎?
💬 問答區
卡關了?直接在這裡問,其他讀者和作者都能幫忙解答。
載入中...
Found this useful? Share it with a friend who’s also getting their hands dirty
Share on LINE